
Oil Head Fake?
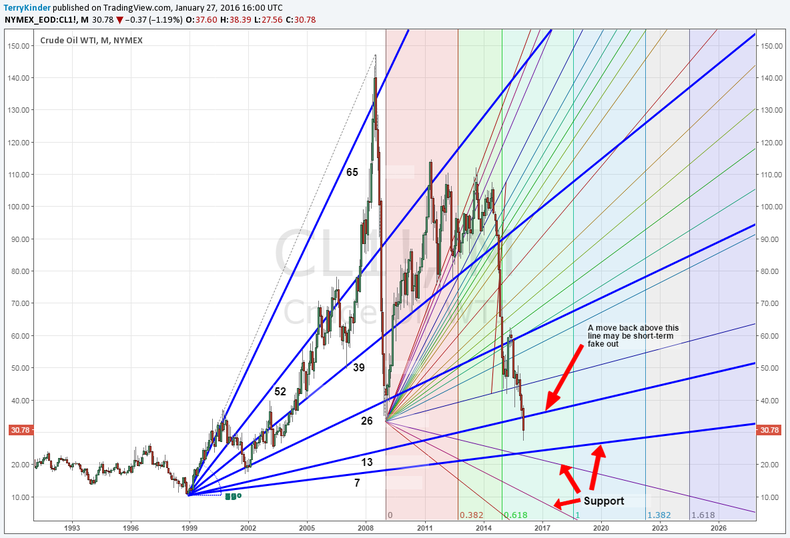
The oil price has gotten a bit of a bounce recently. However, there is some good analysis from the World Cycles Institute, that oil could bounce up to around $35.00 - $37.00 before eventually dipping all the way to about $10.00.
The idea that oil could bounce back to $35.00 - $37.00 doesn't seem unreasonable . . .
Dow Down the Elevator Shaft?
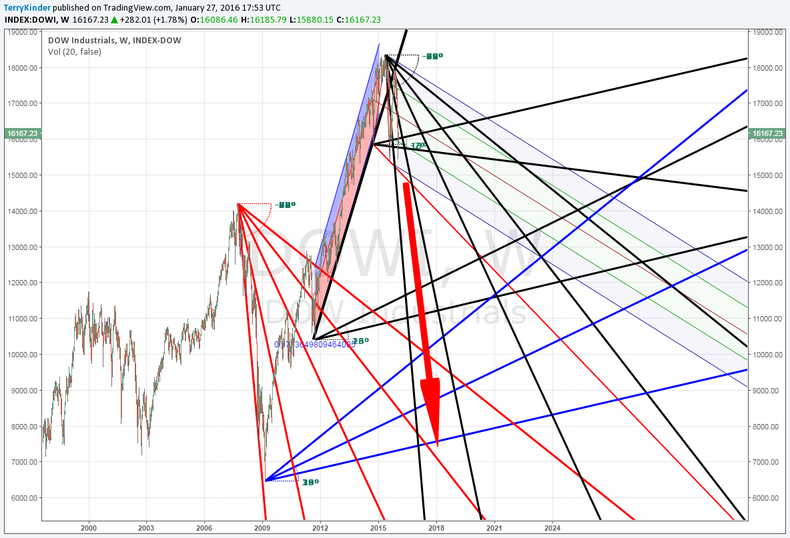
After a pretty sharp rise higher, as evidenced by the pink and blue shaded channel, it looks like the Dow is breaking down.
If the DJIA were to break above the red mid-line of the descending pitchfork it might be worth reconsidering that view.
However, the current Dow looks a bit like the big brother of the 2007 . . .
Silver Schiff Pitchforks
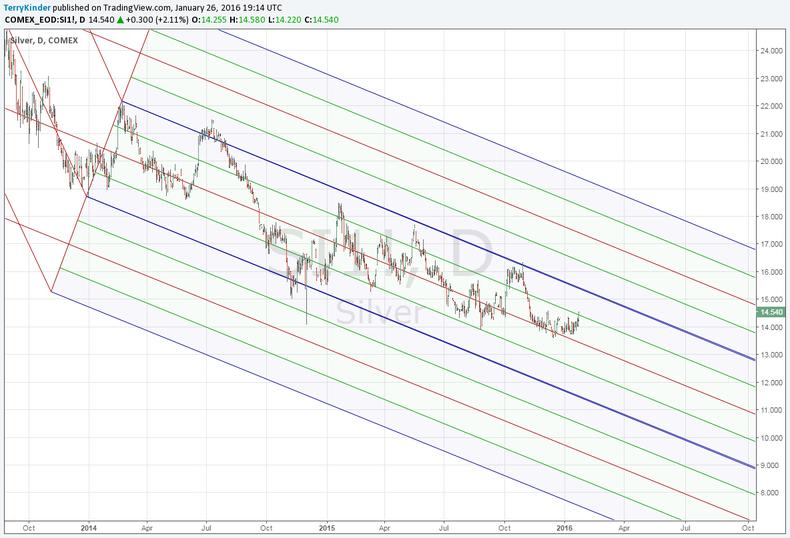
While the silver price has had a bit of a bounce since the end of 2015, not much has really changed on the chart.
The above chart consists of three Schiff Pitchforks stacked on top of each other. The original pitchfork is in the middle with the other two on either side.
The silver price hasn't shown much . . .
DJIA Angles 1932, 1974
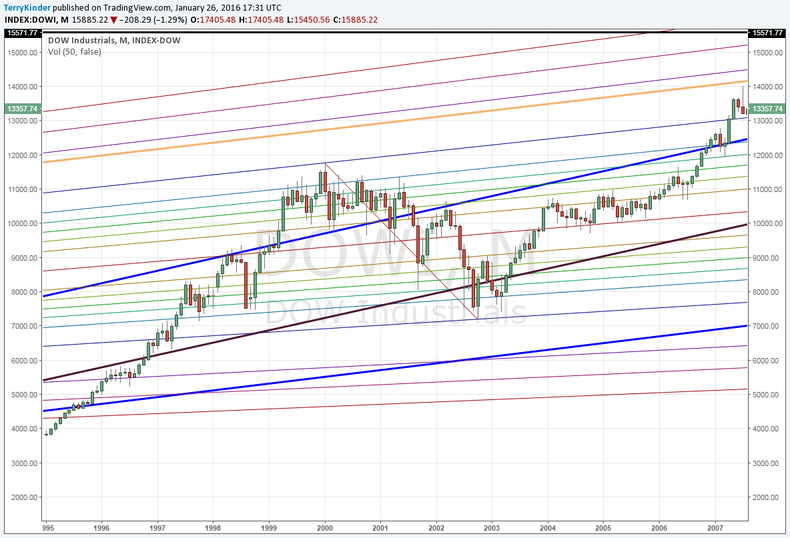
There is an interesting pattern setting up based on lines of growth from the 1932 and 1974 DJIA lows.
In fact a line drawn at 13 degrees (top blue line) from the 1974 Dow low has crossed the DJIA topping formations of 2000 and 2007, and it looks like it's crossing a top forming now as well.

The gold . . .
Gold $1,134.00-$1,138.00 Resistance
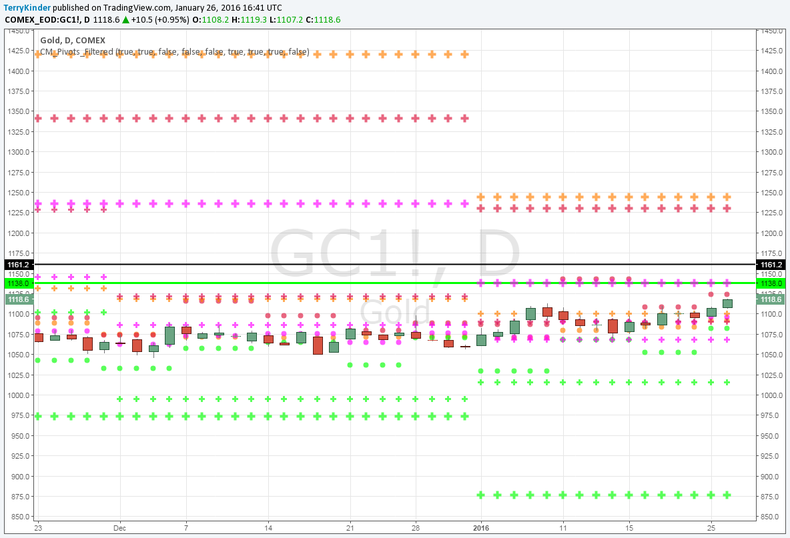
Gold faces an important yearly price pivot area of resistance at $1,138.00.
However, there is also another area of resistance at the $1,134.00 level that will need to be overcome before $1,138.00 can come into play.
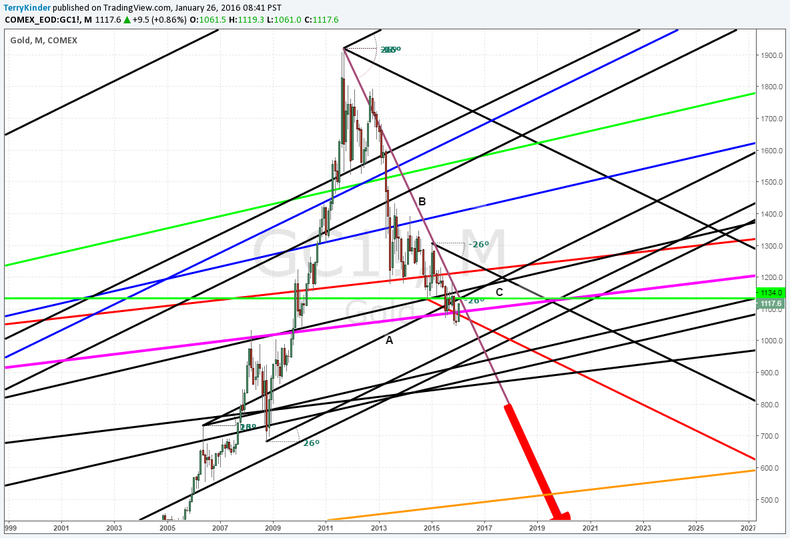
While the second chart is admittedly busy, it's worth taking a look at because it has . . .
10-Year Treasury - Where is the Spike?
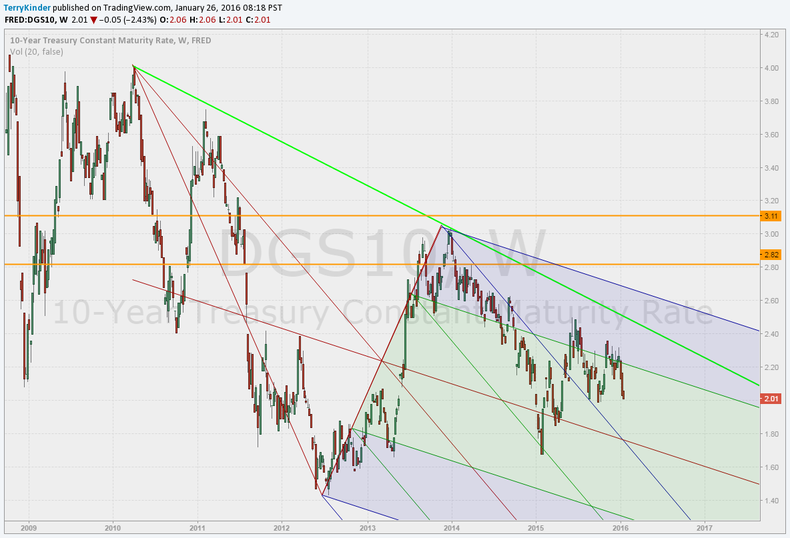
So far a spike higher in the 10-Year Treasury has not occurred. That's not to say that day isn't coming, but it's not here yet.
The above chart consists of two pitchforks. The steeper one is drawn from the 2011 pivot high. The other one is a less steep Schiff Pitchfork.
The green line is a trigger line . . .
SP500 Sub 1,400.00?
Could we be looking at the SP500 below 1,400.00 by the end of 2017?
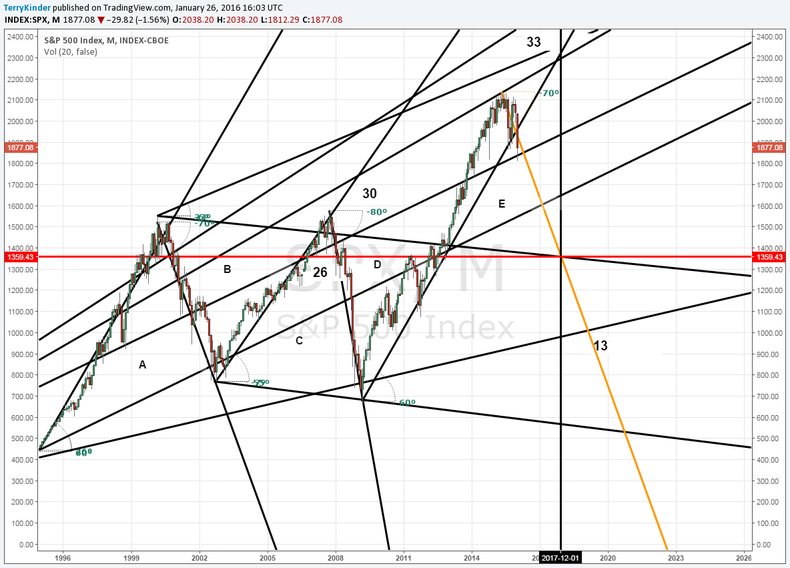
The chart above isn't intended to be exact, but instead an approximation of what may occur. However, based upon the previous pattern of triangles - A,B,C and D, it ought to be in the ballpark.
Cover image credit: http://pixabay.com
